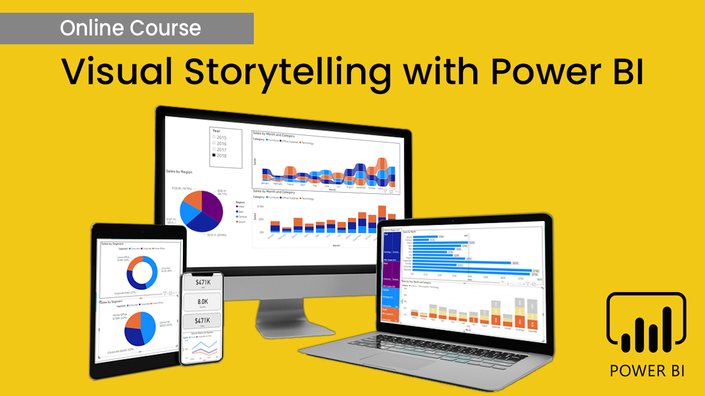
Visual Storytelling with Power BI
Your Instructor

Worked with KPMG, and became a Chartered Accountant Traded Interest Rate Futures, and then worked with J.P. Morgan (Fixed Income)
After a decade of corporate training and winning multiple accolades in Office Productivity and Financial Modelling, in 2015, I created a mission to help 1 million people by 2021. I started creating high-quality video courses and helped people online to become faster-smarter-better at work. A lot of my students at PwC, EY, Deloitte, Amazon, Flipkart, Uber, Tata Group, etc.
- Trained 30K+ professionals through
- 150K+ Online Students
Course Curriculum
Section 1: Introduction
Available in
days
days
after you enroll
Section 2: Charts and Visuals (Part 1)
Available in
days
days
after you enroll
-
StartSlicer - Part 1 (4:46)
-
StartSlicer - Part 2 (Advanced) (2:44)
-
StartMatrix - Part 1 of 2 (7:47)
-
StartMatrix - Part 2 of 2 (4:41)
-
StartTable (2:51)
-
StartPie and Donut (3:44)
-
StartClustered Bar and Clustered Column - Part 1 (9:49)
-
StartClustered Bar and Clustered Column - Part 2 (2:49)
-
StartRibbon (2:57)
-
StartStacked Bar and Stacked Column (4:57)
-
StartTreemap (4:11)
-
StartLine and Area - Part 1 (4:13)
-
StartLine and Area - Part 2 (4:49)
-
Start100% Stacked Bar and Column (4:05)
-
StartCard and Multi-Row Card (4:41)
-
StartStacked Area (2:30)
-
StartPower BI Visualization Course Feedback
Power BI - Webinar
Available in
days
days
after you enroll
FAQs
When does the course start and finish?
The course starts now and never ends! It is a completely self-paced online course - you decide when you start and when you finish.
How long do I have access to the course?
How does lifetime access sound? After enrolling, you have unlimited access to this course for as long as you like - across any and all devices you own.
What if I am unhappy with the course?
We would never want you to be unhappy! If you are unsatisfied with your purchase, contact us in the first 30 days and we will give you a full refund.
